Reckon Insights
Financial reporting software that turns your data into actionable intelligence. Perfect for all sized businesses.
Financial reporting and analytics software
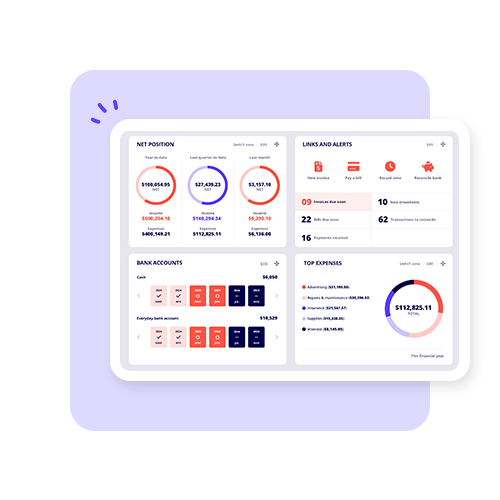
Access your business and financial information in one place for a complete picture of your business using our advanced reporting options.
Track and monitor your business performance
Reckon Insights is a business management solution that provides the platform to collate and model data for a complete picture of your business. Integrate with Reckon One & Reckon Accounts Hosted for enterprise resource planning and rich financial reporting across profitability, cash flow management, accounts receivables, customers and many more reporting tools and key performance indicators. Reckon financial reporting software suits all businesses, particularly those with multiple entities.


Visualise your data for greater insight
Reckon financial reporting software makes analysing your data fast, easy and useful. Select from hundreds of out-of-the-box visualisations or build your own table of contents to fit requirements. Present the data in a meaningful way that encourages data-driven decision-making across your entire business.
Share, collaborate & add value to your own business or clients
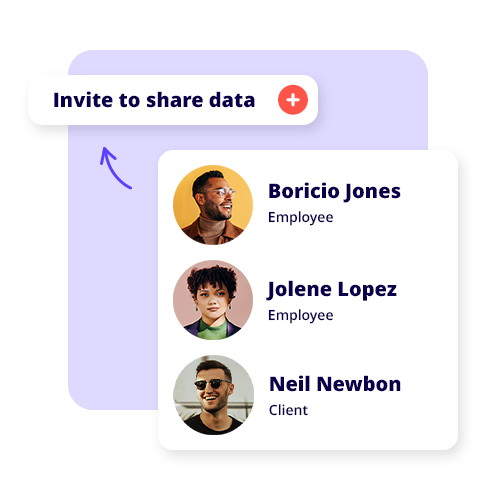
Connect people to the untapped data in your business by inviting them to securely share and manage data and visualisations for specific situations using the best financial reporting software. Schedule delivery of reports to key stakeholders and set up data subscriptions & KPI templates that are perfect for regular meetings or calls.

Affordable, scalable & secure data insights
Utilising leading data-warehousing technology and single sign on access, Reckon financial reporting software ensures your data is safe and only accessible by the right organisations and people. With licences, starting from $39/month for creator and $10/month for viewer, it’s powerful technology you can leverage at a price point any business can afford!
Multiple Entity Reporting with our financial reporting software
Easily review and reconcile the inter-entity transactions and then produce consolidated or multi entity report from multiple sources. Reckon Insights allows you to streamline your reporting processes and analyse your financial, workflow, project, inventory, and sales data all in one place!

Intelligent pricing for smart business insights
CREATOR
Get started with creator to build
reports for your business
$39per user Monthly
Financial and KPI reporting templates
Consolidated Reporting
Financial Reporting
Dashboard Visualisation
KPI’s & Ratios
Accounts Payable & Receivable reports
Bank feeds reporting
Payroll reporting
Dashboard creation
Custom Reporting & Folder creation
Report scheduling and delivery, including email
VIEWER
Add viewer to enable the sharing
of reports to key stakeholders
$10*per user monthly
Financial and KPI reporting templates
Consolidated Reporting
Financial Reporting
Dashboard Visualisation
KPI’s & Ratios
Accounts Payable & Receivable reports
Bank feeds reporting
Payroll reporting
Dashboard creation
Custom Reporting & Folder creation
Report scheduling and delivery, including email
*Must have creator licence to add viewer licences.
Financial reporting software & analytics
Free 14 day trial. Try it now!


