The Best City In Australia to Start Your Business in 2025
We analysed the 50 largest cities in Australia to see which city is the best for starting a business.
New Data: The Best City to Start a Business in Australia
Where you start your business can have a large impact on your success. Access to skilled personnel, fast and reliable internet, a favourable business climate and cost of living contribute to your chance of success.
To help make more informed decisions for business startups, we’ve analysed 17 key data points across Australia’s 50 largest cities, ranked by importance to business owners in 2025. We ran this study last year and compared the numbers to see how things have changed in Australia’s business landscape.
Top 10 places to start a business in Australia
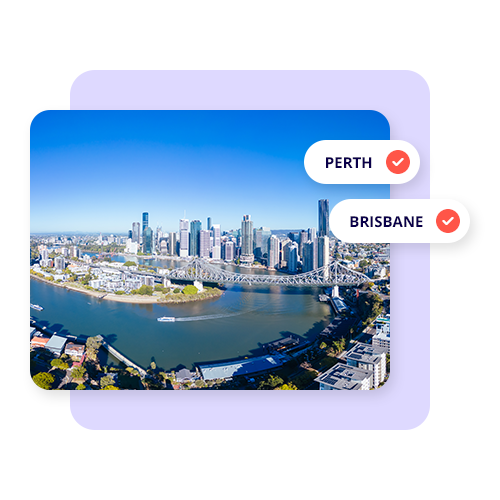
Australia’s startup city landscape is constantly changing. Perth rocketed to first from 20th in just a year, driven by a strong talent pool, robust business environment, and fast internet speeds. Brisbane and Adelaide also surged, placing second and third from their previous spots of 8th and 13th, partly thanks to business and digital infrastructure improvements. Canberra and Queanbeyan dramatically improved by leapfrogging 31 spots to fifth.
Some 2024 front-runners have slipped. Geelong dropped out of the top 10, and Ballarat fell from second to eighth. These changes highlight how competitive the startup landscape in Australia can be.
The best place to start a business by state
New South Wales
Wollongong and Newcastle climbed from last year, balancing business opportunity, talent and connectivity. Both cities are attractive options as Wollongong offers strong internet speeds and a lower cost of living, whereas Newcastle enjoys a strong business landscape. The gap between cities and regional hubs is narrowing as places outside Sydney and Canberra offer viable and smart options.
Queensland
Victoria
Melbourne and Ballarat placed ahead of Geelong, as all three cities share close scores. Each city boasts healthy internet speeds, but Melbourne’s top talent pool beats them out to 1st. Ballarat secured 2nd with its lower cost of living pressures, and Geelong takes 3rd, enjoying a balance in talent, business appeal and digital infrastructure.
Shepparton Mooroopna remained fourth, thanks to high internet speeds and a reasonable cost of living score. Places like Warragul and Drouin, and Traralgon and Morwell struggle to build strong foundations, with all-around relatively low scores.
Northern Territory
South Australia
Western Australia
Geraldton takes second with a low-cost lifestyle and solid digital infrastructure. Kalgoorlie-Boulder dropped in ranking due to declines in all scores besides internet speed. Busselton slid to sixth from third in 2024 due to drops in internet performance.
Tasmania
Best and Worst City by Factor
Breaking it down by factors, no single city dominates across all metrics. Canberra and Queanbeyan lead in median income ($1,613.42) and education (47.9%). Sydney tops young workforce (679,700), business density, and health (65.9%), but faces high mortgage ($6,038.82) and transport costs ($564.18). Darwin boasts a strong labour force participation (75.4%) but lags in latency (62.0ms) and business survival (48.9%).
Coffs Harbour has the lowest income ($1,129.66) and weakest labour force (52.2%). Mount Gambier ranks lowest for internet speeds (49.6 Mbps download, 14.2 Mbps upload). Ballarat offers the lowest rents ($435), while Kalgoorlie-Boulder has the most affordable mortgage repayments ($1,783.41).
Best place to start a business by factor
Talent Pool
Business Landscape
Internet Speed
Cost of Living
Where does your city rank?
ABOUT THE DATA
Methodology
This comprehensive study by Reckon evaluates the top 50 most populated Australian cities (50 largest urban areas in Australia by the Significant Urban Area** measure using ABS Regional Population data) for startup viability, integrating data from survey responses from small business owners around Australia and public datasets.
The results highlight cities excelling or underperforming in specific categories and those with high overall scores for business startup suitability. Our analysis looks at 17 essential socioeconomic factors mapped into 4 major categories consisting of Talent Pool, Business Landscape, Internet Speed and Cost of Living.
- Talent Pool assesses workforce quality through median weekly incomes, demographic and educational factors, drawing various data sets from the ABS.
- Business Landscape evaluates the business environment through business density, growth, and survival rates, using government data.
- Internet Speed reviews infrastructure capabilities based on median internet speeds and latency, with Speedtest by Ookla providing the necessary data.
- Cost of Living considers living affordability through median rent, mortgage repayments, commute costs, and childcare fees, informed by government and industry publications.
We collected the aforementioned data alongside over 800 survey responses from small business owners across Australia. This data was then processed through the following 5 steps:
- Data collection from various government and authority sources
- Normalisation of Likert scale survey responses and determining aggregated weightings for each factor/category
- Creation of factor scores that are aggregated for all cities and normalised into a 0-100 scale.
- Factor scores are aggregated and adjusted by survey weightings to create category scores
- Overall Scores are calculated by combining category scores according to survey weightings.
It is important to understand that although the study seeks to provide a statistical representation of the best location to start a business it does not serve as financial advice for those seeking to do so. Moreover, comparing metrics collected via multiple sources may result in slight variations due to differences in data collection methodology.
The factors used are as follows:
Talent Pool:
- Personal Median Weekly Incomes – people aged 15 and over (employee earnings from main and second jobs)
- Young Workers – the number of workers aged 20-29
- Labour Force – percentage of people aged 15 years and over in the labour force
- Unemployment – percentage of people who reported being unemployed, aged 15 years and over
- Education – percentage of people aged 15 years and over with a Bachelor Degree level education & above
- Health – percentage of people with no long-term health condition(s)
Business Landscape:
- Business Density – number of businesses in the city
- Business Growth – annual percentage change in businesses
- Short-Term Business Survival – business survival rate year 1 (state*)
- Long-Term Business Survival – business survival rate year 3 (state*)
Internet Speed:
- Internet Download – median internet download speed
- Internet Upload – median internet upload speed
- Internet Latency – median internet latency
Cost of Living:
- Rental Prices – Median weekly rent
- Mortgage Costs – Median monthly mortgage repayments
- Transport Costs – Average weekly transport costs (capital city vs. regional centre*)
- Childcare Costs – Hourly fees for centre based childcare
*Please note that statewide numbers have been used for business survival rates, while capital city vs. regional centres of each state have been used for transport costs due to a lack of accurate city-specific data.
Notes on the Data
The data collection and methodology of data sources from some factors differ from the previous version of the Startup Cities Report, and therefore, caution should be taken when making direct comparisons to individual factors.
Some factors have come from data sources that are only available at the SA3 or SA4 level, and thus have been converted to SUA. Data for SA4 regions have been amalgamated, where necessary for conversion purposes. Please note that there is an imperfect correspondence between these levels of geography. For example, the SA4 region of Bunbury has been used for the SUA regions of Bunbury and Busselton.
Talent Pool
The ABS’ Characteristics for Employment 2024 dataset used for metrics in Talent Pool was obtained at the SA4 level, with “Western Australia – Outback” having combined North and South. These combined figures were used for SUAs “Kalgoorlie – Boulder” and “Geraldton”
Median weekly Incomes have been interpolated from the distribution across income ranges at the SA4 level from the ABS Characteristics of Employment, 2024 data. Incomes include employee earnings from main and second jobs and do not factor in those who did not draw a wage or salary and those who are not employees or owner managers of incorporated enterprises. Please note that these numbers reflect the working population income, and therefore, the medians are naturally higher than the general population income reported in the Census.
Business Landscape
For SUAs that exist across state borders, such as “Gold Coast – Tweed Heads”, an average was taken across the two states for the state-level measures of business survival rate.
Internet
Fixed broadband internet speeds were used for comparison. Open data was sourced from Q1 2025 Ookla speed tests and mapped according to SUA shapefiles to obtain the median download speed, upload speed and latency from the average tests within the region.
Cost of Living
The median monthly mortgage repayment has been extrapolated from median house values from house sales in the year to January 2025 in each SUA, assuming a 20% deposit with a 6.25% interest rate and a loan term of 30 years.
The transport costs for capital cities and regional centres in each state have been used as proxies for other cities based on their location, for example:
- Wagga Wagga has been used as a proxy for non-capital SUAs in NSW, such as Bathurst.
- New South Wales Regional has been used for Albury – Wodonga.
- Australian Capital Territory was used for Canberra – Queanbeyan; and
- Queensland Regional was used for Gold Coast – Tweed Heads.
Childcare costs are the average hourly costs of centre-based child care, excluding home care.
“Starting a small business in Australia isn’t easy, especially with the rising cost of living. But small businesses really are the engine room of our economy, and we’re seeing growth pop up in places you might not expect. When we looked at things like talent, infrastructure and affordability, it became clear that opportunity is no longer confined to the capital cities. It was especially surprising to see places like Geraldton, Nowra, and Darwin make such big leaps in the rankings compared to 2024. Geraldton jumped 32 spots, and Nowra jumped 20, showing that regional centres with improving infrastructure and liveability are catching up fast. Even Darwin, which has traditionally faced challenges around remoteness, surged 19 places thanks to strong talent and affordability scores.
“On the flip side, some of the more established cities like Bendigo and Warrnambool saw steep declines, suggesting that cost pressures or infrastructure limitations may be starting to hold them back. These shifts highlight how quickly the landscape can change and just how important it is to look beyond the usual hotspots when planning a new venture.
“For business owners, flexibility is everything. It’s important to always keep an eye on emerging markets with the right mix of talent, affordability and infrastructure. A lot of the time, the best opportunities are in places flying under the radar. Invest in digital, stay close to your local community and don’t be afraid to think beyond the big cities. That’s where you’ll often find the real potential.”


Download the full report
Ready to start your new venture? Find out where you should and shouldn’t start up.

Katy Walker, The Clearing Room
set-up reckon one
Accounting software made for every small business
Spend less time managing your finances and more time growing your business.
Related articles

Read more >

Read more >

Read more >


