Australia’s Hardest Working Cities
We’ve looked at 7 weighted factors like working hours, productivity and unpaid domestic work to create an index score for each city, determining which is the hardest working.


Australian work culture embraces the “grindset”
Australians are considered some of the hardest-working citizens in the world. In fact, at the start of the 2000s, Australia was ranked the hardest-working nation in the Western world, only surpassed by Japan and the US.
With that in mind, we wanted to uncover the working habits across the nation and reveal which cities are the hardest working in Australia. We combed through the latest ABS data and weighed various factors to assign each Australian city a hard-work index score — and the results even surprised us!
The top 10 hardest working areas in Australia
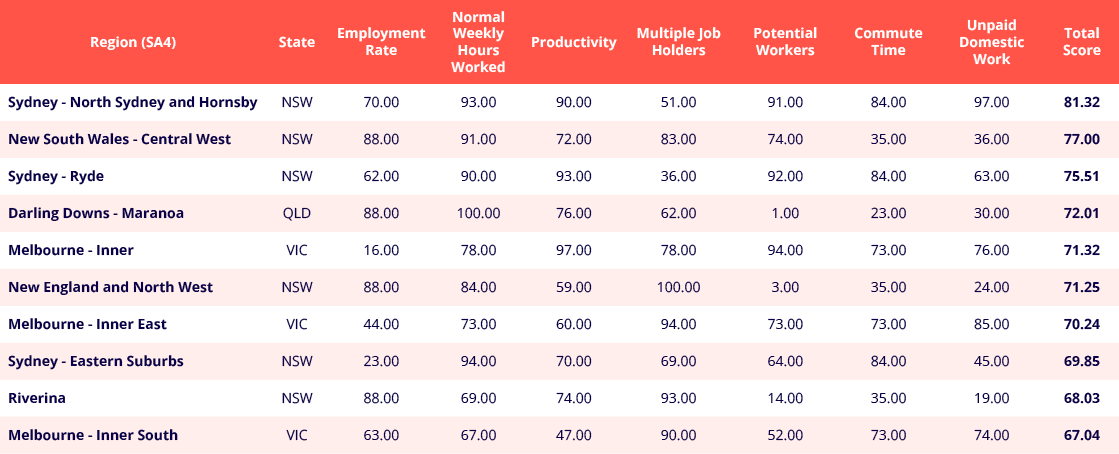
The North Sydney & Hornsby region in New South Wales secures the top spot as Australia’s hardest working region with high scores across the board, excelling on factors like working hours, productivity and unpaid domestic work. In fact, New South Wales regions dominate the top 10 list with 6 entries, occupying the entire top 3 with Central West and Ryde regions coming in at 2nd and 3rd respectively.
Victorian regions led by Melbourne Inner, Inner East and Inner South also made the top 10 list, with high scores on factors like working hours, productivity and commute time scoring higher in both the Sydney and Melbourne regions.
The Queensland region of Darling Downs – Marona is the only QLD region to crack to the top 10, claiming the 4th spot led by the highest score on working hours in the country, accompanied by a high score on employment rate and productivity.
Notably, No region from SA, NT, ACT, WA or TAS made the top 10.
Which capital city works hardest?
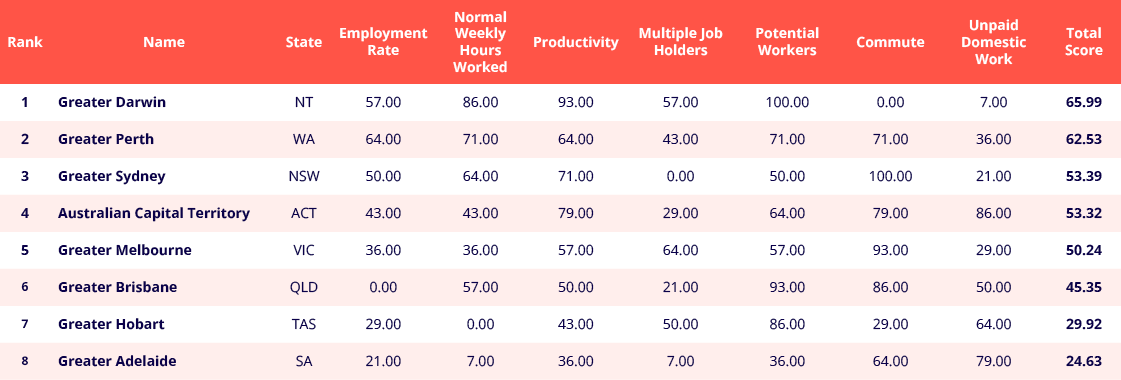
Despite being the least populated, Darwin has emerged as the hardest working capital city. The number one spot was secured by impressives scores on productivity and potential workers. To top it off, Darwin is by far the capital city in Australia with the highest working hours score while also being the capital city with the highest proportion of multiple job holders. Perth takes the second spot ahead of Sydney, while Adelaide comes in last.
Hardest working regions in each state
New South Wales
Sydney regions dominate the NSW top 5 with North Sydney & Hornsby region coming in 1st place, Ryde in 3rd while the Eastern Suburbs takes the 5th spot. Regional NSW is also represented by Central West in 2nd place and New England & North West in 4th. Compared to the other states, NSW comes in on a 3rd spot overall, only overtaken by NT and WA. NSW has the highest commute score, revealing that workers from NSW spent the most time commuting to work of all across all states.
Perhaps unsurprisingly, the most common occupation across the 3 Sydney regions is the ‘Business, Human Resource & Marketing Professionals’ category. For Central West and New England & North West the most common occupation is ‘Sales Assistants & Sales Persons’. Despite the median weekly household income in the Sydney regions being more than $1,000 higher than the regional areas, both are extremely hard working, cracking the state’s top 5, which could suggest that income may not be the best indicator to determine how hard people work, despite popular beliefs.
New England & North West is the region with the highest multiple jobs score in the country.

Victoria
In VIC, Melbourne regions dominate the top 3 positions with Melbourne Inner, Inner East and Inner South regions all scoring within 5 points of each other. In fact, 6 of the top 10 spots in VIC are located in Melbourne. Melbourne Inner has the 4th highest productivity score in the country.
Warrnambool & South West region, where the most common occupation is ‘Farmers & Farm Managers’ comes in 4th place, with the highest working hours score in VIC and 4th highest in Australia.
Overall compared to the other states VIC is ranked 5th, with only TAS and SA scoring lower.

Queensland
In QLD, the Darling Downs – Marona region holds the highest position in the state and ranks 4th overall in the nation. The top QLD spot is secured by having the highest working hours score in all of Australia. Only one Brisbane region features on the top 5 list, showcasing just how hard working the rural part of QLD is.
Overall compared to the other states, QLD ranks in the 5th spot and has the 2nd lowest employment rate score compared to the other states.

Nothern Territory
NT is truly a state of extremes when looking at the scoreboard for hardest working factors, scoring either as the highest or lowest state in the country in 5 of the 7 factors analysed.
Overall, NT has the highest employment rate and working hours rate of any state in the country, and the 2nd highest productivity score. On the other end of the scale, NT has the lowest commute and unpaid domestic work scores of any state.
Both the NT regions analysed rank relatively well, with Darwin taking the lead. Although Darwin is the state’s capital, the outback region has a significantly better employment rate and more people with multiple jobs. The two NT regions rank closely with only a total score difference of 3.

Western Australia
In WA in general, an impressive productivity score stands out across the state.
The Inner Perth region, perhaps unsurprisingly, ranks first in the state, scoring well across all factors, especially productivity, which is the 3rd highest in the whole of Australia.
Interestingly, the region with the highest productivity score in the country is also in WA with Western Australia Outback (North & South) region clinching the top productivity spot and coming in 3rd overall in the state. This likely comes from the large mining industry in this area, giving it a Gross Regional Product of over $600,000 per capita, the highest across Australia. For comparison, Sydney City & Inner South, which has the 2nd largest Gross Regional Product, sits on just over $500,000 per capita, a 20% difference.
Overall compared to the other states, WA ranks as the 2nd hardest working state in Australia with only NT scoring higher.

South Australia
SA comes in last compared to all other states. Central & Hills region in Adelaide takes the lead in SA due to its unpaid domestic work score, which is the 2nd highest score in the country. In fact, 2 of the 3 regions with the highest scoring unpaid domestic work is in SA. Coming in a close 2nd is the Barossa-Yorke-Mid North region.
SA has the lowest statewide scores on the factors of multiple job holders and potential workers, along with the 2nd lowest scoring on working hours and productivity.

Tasmania
Overall, TAS is ranked as the 2nd least hard working state in Australia, with only SA scoring lower. Exactly like NT, TAS is scoring either as the highest or lowest state in the country in 5 of the 7 factors analysed.
TAS has the lowest state score for employment rate, working hours and productivity scores, but scores the highest for multiple job holders as well as unpaid domestic work.
Out of the four regions in Tasmania, the state’s capital ranks last in the state likely due to its low working hours score. Taking the lead is Tasmania’s South East region being carried by a strong employment rate score, which secured the number one spot despite its very low productivity and potential workers scores. The South East region also holds the best unpaid domestic work score in Australia.
The most common occupation in the hardest working region in TAS, the South East region, is ‘Farmers & Farm Managers’, followed by ‘Cleaners and Laundry workers’ and ‘Hospitality, Retails & Service Managers’.

Key Takeaways
ABOUT THE DATA
This study utilises the State/Territory Areas, Greater Capital City Statistical Areas (GCCSA) and Statistical Area Level 4 (SA4) boundaries and definitions as per the Australian Bureau of Statistics (ABS) guidelines to assess which are the hardest working states, cities and regions in Australia. The term capital city is used in reference to the city’s greater capital boundary, while region is used in reference to SA4 boundaries.
Our analysis uses 7 weighted factors, categorised as either direct and indirect factors to create an index score of each region to determine which is the hardest working. Each metric provided was graded on a 100 point scale proportional to its importance in determining hard work, with regions then given a weighted index score that was used to rank from highest to lowest. Note that scores at each geographical level are not directly comparable between one another (i.e. state, city and regional level).
Data is sourced from the most recently available public datasets for each factor. A full list of weighting and data sources are provided in the table below. Working age is defined by the ABS as those who are above 15 years old. Please note that comparing metrics collected via multiple sources may result in slight variations due to differences in data collection methodology.
Direct:
● Employment Rate reviews the level of employment in the region, measured by the share of the working age population in the region that are employed
● Working Hours evaluates the time burden taken on by workers by measuring the distribution of normal working hours of employed persons per week
● Productivity assesses the gross output generated by the region’s population based on the product dollar value generated by each person.
● Multiple Job Holders considers the extra load taken on by those who take on multiple jobs through the share of employed workers in the region who are employed with more than one job.
Indirect:
● Potential Workers accounts for the proportion of unemployed individuals who at the time of recording were not employed but were available and looking to work of those in the working age population
● Commute Time* factors the toll taken on workers to get to and from their place of employment, which is measured by the average commute time.
● Unpaid Domestic Work gauges the level of duty individuals take on at home based on the distribution of unpaid domestic work hours
*Please note that greater city or rest of state data have been used for commute time due to a lack of accurate region-specific data. TAS, ACT and NT use statewide data only.
The data was processed through the following 3 steps:
1. Data collection from various government and authority sources
2. Data from each factor are normalised by rank and scores are aggregated and adjusted by weighting to create category scores
3. Overall scores are calculated by combining category scores according to weighting.
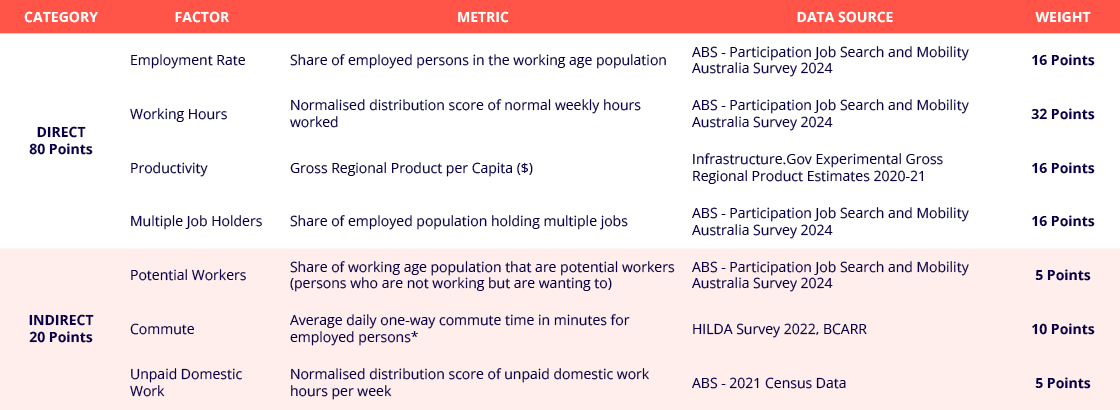
*Please note that greater city or rest of state data have been used for commute time due to a lack of accurate region-specific data. Data only includes non-zero values reported by employed persons.

Analysis on relationships with comparison factors have been explored using SA4 level data.

Download the full report
Discover Australia’s hardest-working cities through 7 weighted factors, and see which city tops the list.

“Reckon Payroll is so easy to use & even gives you your pay slips. I would highly recommend it to any business.”
Curves Gym, Ulladulla
set-up reckon Payroll
Payroll software made for every small business
Manage wages, leave, super and Single Touch Payroll for your employees.
Related articles

Public holiday pay rates: how to calculate it?
Read more >

6 payroll mistakes to avoid
Read more >

Salary sacrifice explained: payroll guide for employers
Read more >


